


DMT - Clay (Das, Marchetti, 2026)
This p-y curve is derived from dilatometer test (DMT) results. Its shape follows a hyperbolic tangent function, and the curve is suitable for clayey soils. The curve is shown in Figure 1.
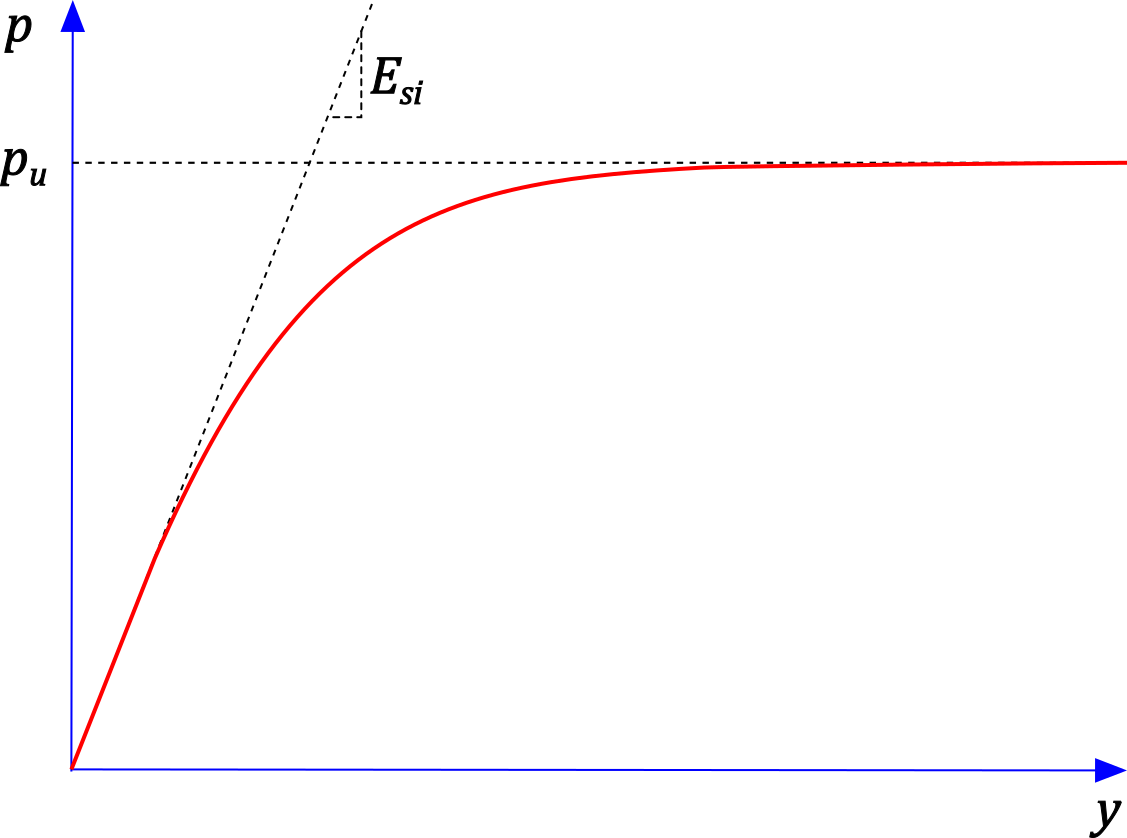 Figure 1: p-y curve DMT - Clay (Das, Marchetti, 2026)
The input parameters for determining the curve are:
d [m] | – | pile diameter |
z [m] | – | depth below the ground surface |
p0 [kPa] | – | initial pressure measured by the dilatometer |
u0 [kPa] | – | hydrostatic pore water pressure from the dilatometer test |
Ed [MPa] | – | dilatometer modulus from the dilatometer test |
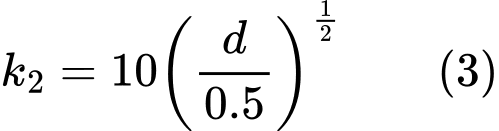
The basic parameters that characterize the shape of the curve are the initial soil modulus Esi and the ultimate soil resistance pu. Esi defines the initial slope of the curve, and pu is the value that the curve approaches asymptotically. To determine these parameters, coefficients accounting for the pile diameter and the depth below the ground surface are calculated first:


The initial soil modulus Esi is then given by:

and the ultimate soil resistance pu is given by:

The function describing the resulting p-y curve has the following form:
