


CPT - Clay (Truong, Lehane, 2014)
This p-y curve is derived from cone penetration test (CPT) results and is suitable for clays. Its shape is shown in Figure 1.
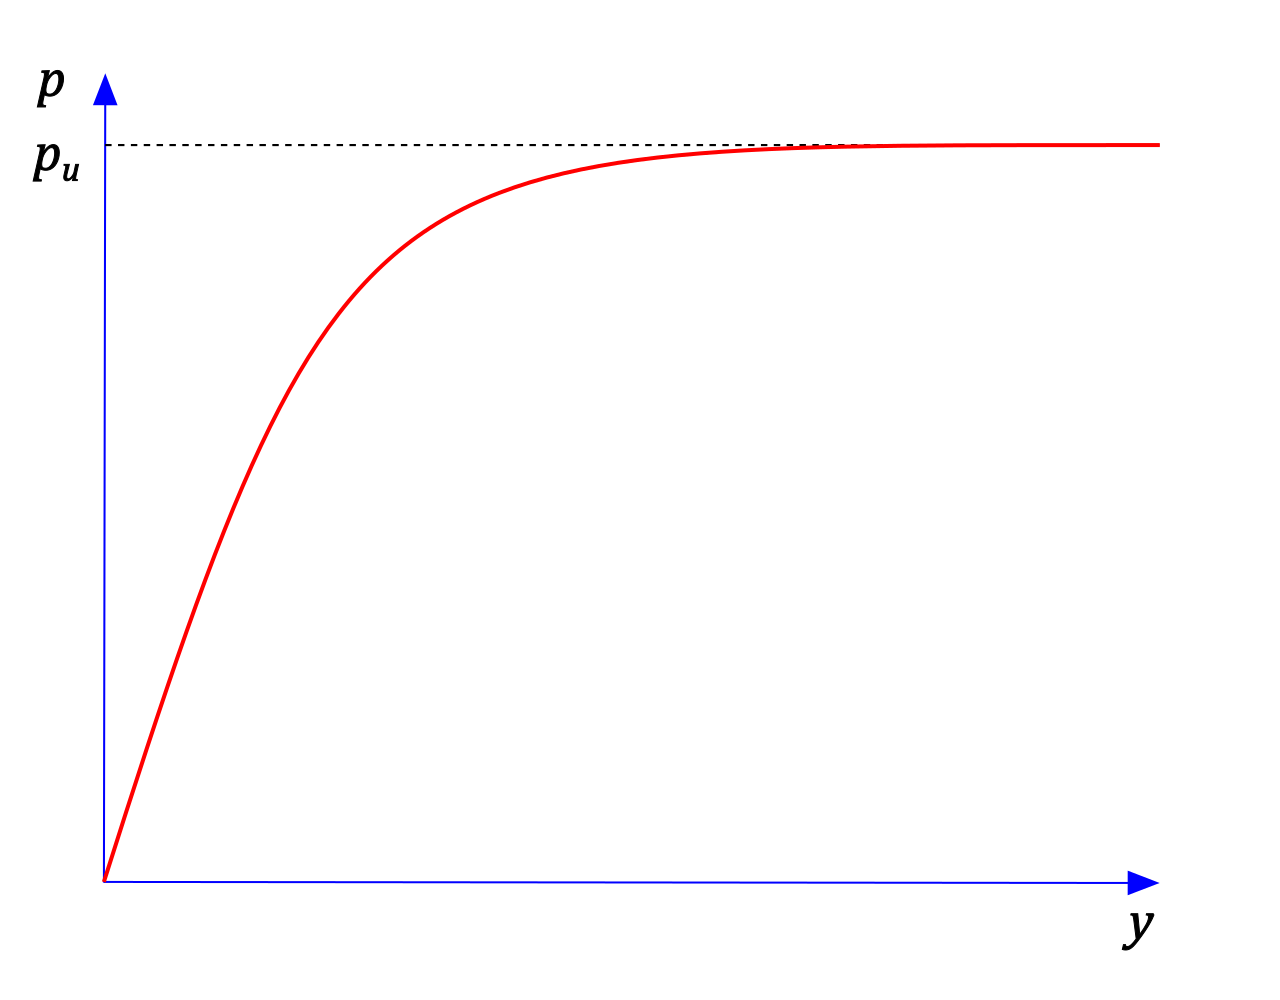 Figure 1: p-y curve CPT - Clay (Truong, Lehane, 2014)
The input parameters for determining the curve are:
d [m] | – | pile diameter |
z [m] | – | depth below the ground surface |
γ [kN/m3] | – | unit weight of the soil |
qc [MPa] | – | cone resistance from the cone penetration test |
E [MPa] | – | modulus of elasticity of the soil |
Nkt [-] | – | cone factor, typically between 10 and 20 |
The basic parameter for determining the shape of the curve is the soil rigidity index IR, defined as:
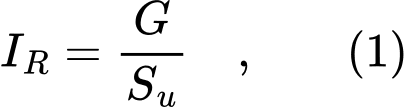
where G is the shear modulus of the soil and Su is the undrained shear strength of the soil.
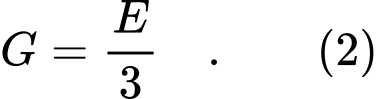
The shear modulus of the soil G is taken as:
The shear strength is calculated from the values obtained from the CPT:
According to EN ISO 22476-1, the corrected cone resistance qt and the net cone resistance qnet are calculated as follows:


where u2 is the pore water pressure in the soil, a is the cone area ratio, taken here as 0.75, and σtot is the total stress in the soil.
The undrained shear strength Su is directly related to the corrected cone resistance from the CPT through the factor Nkt:
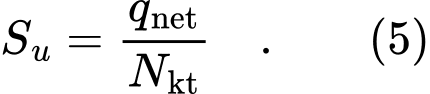
Substituting (5) into (1) gives the relationship for calculating the rigidity index IR, which is then used to determine the p-y curve:

The ultimate soil resistance pu is calculated as follows:

The resulting p-y curve is described by two functions, depending on the z/d ratio.
For z/d < 3, the following applies:

and for z/d ≥ 3, the following applies:

References:
[1] P. Truong, B.M. Lehane: Numerically derived CPT-based p-y curves for a soft clay modeled as an elastic perfectly plastic material. In:Robertson, P.K. and Cabal, K.L. (eds) Proceedings of 3rd International Conference on Cone Penetration Testing, 12–14 May 2014, Las Vegas, USA, 975–982.